Answers to Question 17 of Part 2 – click to enlarge images
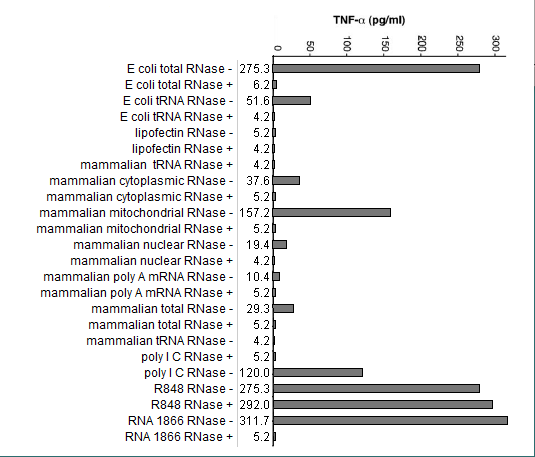
(1) Compare the response of in vitro-transcribed RNA (RNA 1866) to the responses of natural RNA samples. What are some possible hypotheses that could be tested to explain this result?
The investigators were hypothesizing that modifications of nucleosides in the samples were responsible for differences in immunologic effect. Other factors could possibly be involved, including the arrangement of nucleosides, length of the nucleic acid chains, artifacts related to sample preparation, etc.
(2) Why did the investigators test each substance in the presence and absence of RNase, and why was only one of the 12 substances unaffected by the presence of this reagent?
RNase is an enzyme that degrades RNA. This was included as a control, to see if something about the experimental procedure other than mRNA was inducing an immune response. The only substance that was not affected by RNase was R-848 (Resiquimod), an agonist for TLR-7 and TLR. R-848 is an imidazoquinoline, not a nucleic acid polymer, so it would not be degraded by RNase.
(3) Compare results among the mammalian RNA samples tested. How can you explain the differences in response among these samples?
The only mammalian sample that induced the production of TNF-alpha was mitochondrial DNA. Mitochondrial DNA shares more characteristics with bacterial DNA (see below).
(4) Compare results between the E.coli samples. How can you explain the difference in response between these two samples?
One possibility is that bacterial tRNA has more nucleoside modifications than other types of RNA present in the total bacterial sample.
(5) What is a possible reason for the differences in the response of E.coli compared to the mammalian samples?
Bacterial may have fewer nucleoside modifications than mammalian samples, an idea supported by the relatively greater ability of mammalian mitochondrial DNA to induce an immune response.
(6) Why were lipofectin and poly IC included among the substances tested?
As negative and positive controls, respectively.
(7) Only a single run of the experiment was performed in this simulated example. In reality, how many replicates are usually used when ELISA is run, and why is this done?
The investigators conducted three or more runs of each experiment. Based on the error bars shown in the original publication, there was not much variability among runs.
Notes on Cytokine ELISA simulation
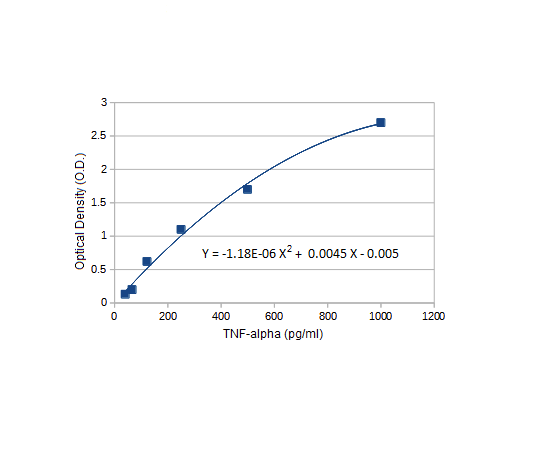
Standard curves: Case It uses equations from representative standard curves to plot bar charts. Those curves can be accessed by clicking the ‘Standard curve’ tab on the ‘ELISA bar chart’ window (one is shown above, for TNF-alpha). In reality, standard curves would be based on known samples included with each experimental run.
Replicates: For simplicity, the cytokine ELISA experiments in this exercise do not include replicates. The bar charts generated by the Case It simulation are representative of those shown in Kariko et al. 2005, each of which was based on three replicates.
File construction: For this exercise, ‘protein’ files used by the Case It simulation contain actual sequences for TNF-alpha and other cytokines, along with numbers used for standard curve calculations. ‘Antibody’ files do not contain actual antibody sequences, but rather contain a portion of the cytokine sequence, enabling matches to occur so that colors can appear in wells of the 96-well plate. In reality, antigen-antibody reactions involve complex three-dimensional interactions.
Answers to Question 30 of Part 2 – click to enlarge the images
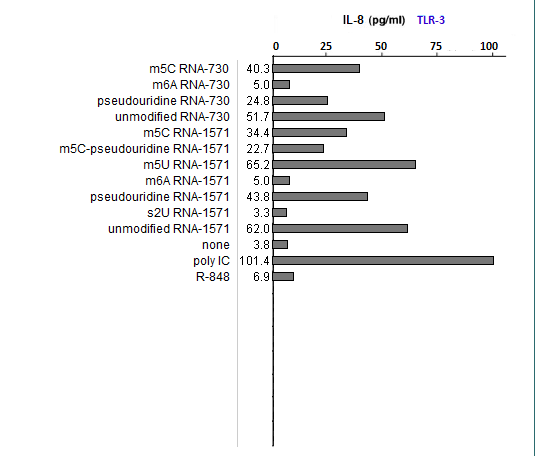
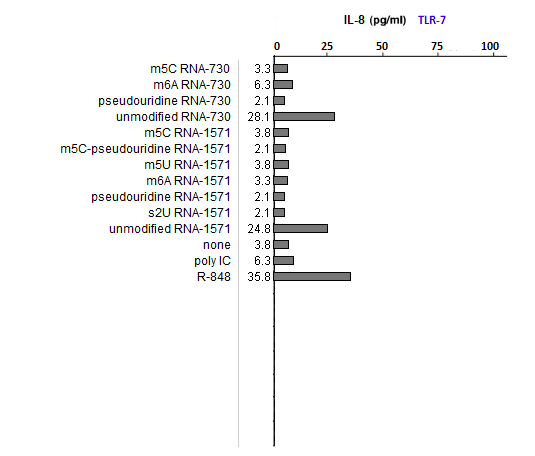
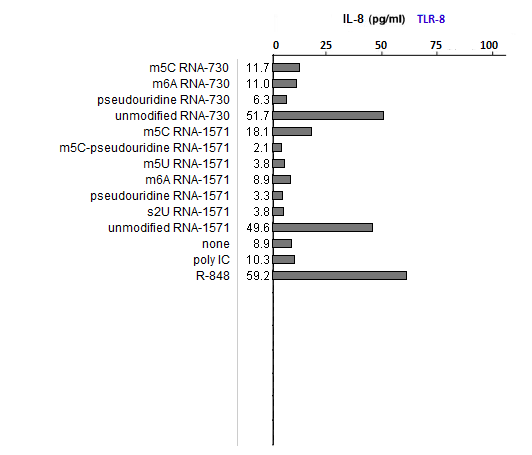
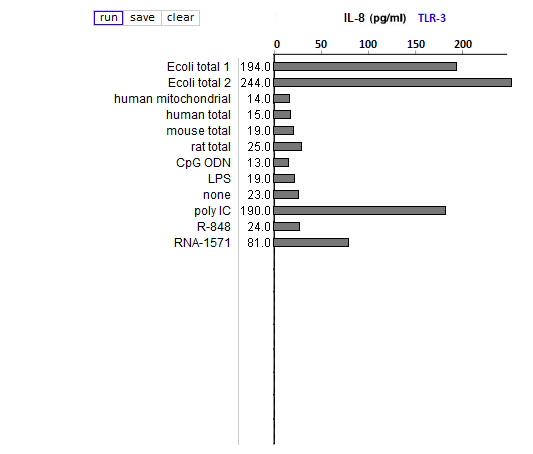
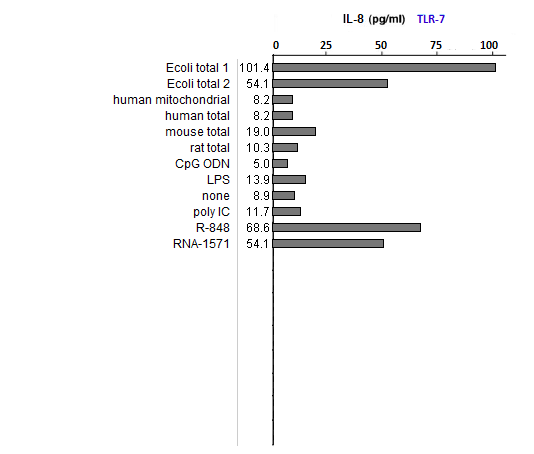
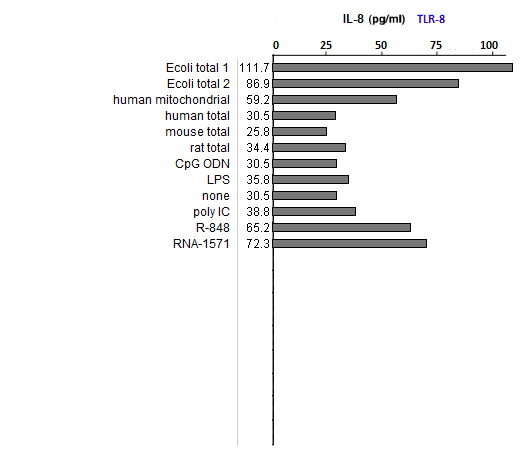
(1) What could account for differences in the relative effects of R-848 and Poly IC on the three TLRs?
R-848 is a known agonist for TLR7 and 8, whereas poly IC is a known agonist for TLR3. These two substances served as positive controls.
(2) Is the relative effect of unmodified mRNA the same for the three TLRs? What might account for any differences that you observed?
Unmodified mRNA induced production of IL-8 by all three TLRs, with any differences due most likely to random variability.
(3) Are the relative effects of the various nucleoside modifications the same for the three TLRs? What might account for any differences that you observed?
The effects varied, with m6A and s2U modifications suppressing the ability of RNA to stimulateTLR3, and all modifications able to suppress the ability of RNA to stimulate TLR7 and TLR8.
Answers to Question 39 of Part 2 – click to enlarge images
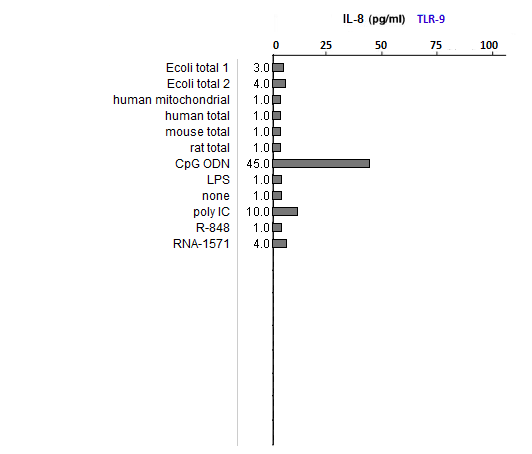
(1) All samples used lipofectin as a transfection agent, but only one of them included only lipofectin (the one labeled ‘none’). Why was this sample included in the analysis?
As a negative control, to eliminate the possibility of lipofectin transfection inducing IL-8 production.
(2) What could account for differences in response between the two E. coli samples?
Both strongly induced IL-8 production, with differences due to the fact that they were from different sources.
(3) Compare the E. coli samples with the human, mouse, and rat samples. Are any differences that you see statistically significant? How would you go about determining this?
You would need to run replicates of the experiment (which was done in the original publication), then run statistical tests on the results. The differences between the bacterial and mammalian samples were so striking that a statistical comparison was not necessary. The authors did provide error bars on the original bar graphs showing very little variability among replicates. Less suppression of the ability of RNA to stimulate an immune response is evident for TLR8 compared to TLR3 and TLR7, but even in this case the E.coli samples strongly induced IL-8 expression.
(4) Why did the results for TLR9 differ from the results for the other TLRs?
Because TLR9 is stimulated by DNA, not RNA. CpG ODN was used as a positive control, as this substance is unmethylated and also mimics microbial DNA due to its CG bonds. It thus mimics the effect of microbial DNA, not RNA, which is why it simulates TLR9 but not TLR3, 7, or 8.
(5) How do results from tests of natural RNA provide insight into the results of tests involving in vitro-transcribed RNA?
See above. Bacterial isolates did not induce IL-8 production of TLR9 but did induce IL-8 production in the TLRs that respond to microbial RNA. The in vitro-transcribed RNA used did not have the modified nucleosides characteristic of mammalian RNA and hence was similar to microbial RNA in its ability to stimulate TLR3, 7, and 8.
Answers to Question 13 of Part 3 – click to enlarge images
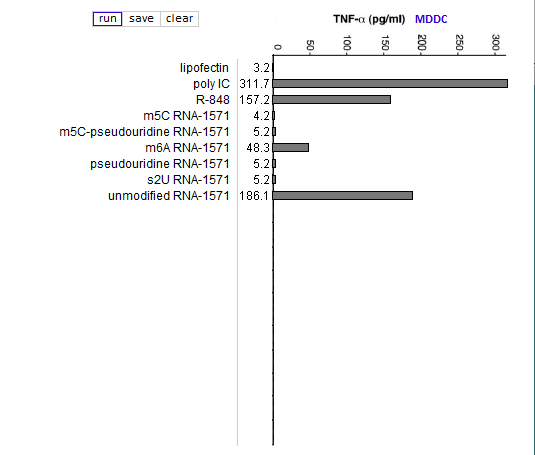
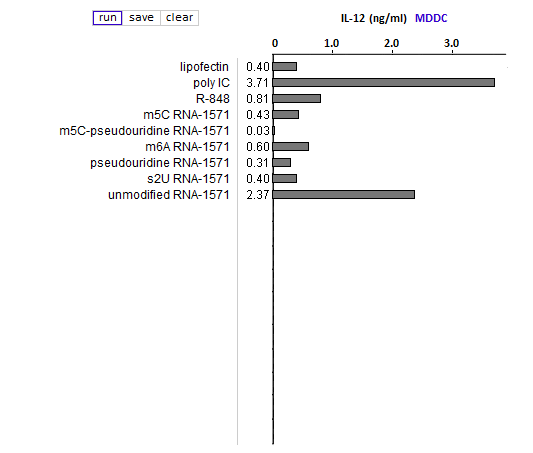
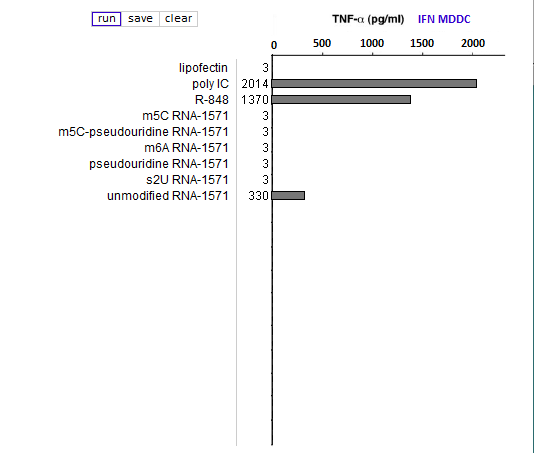
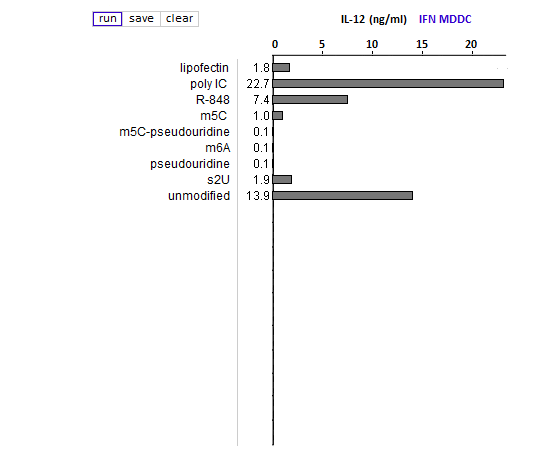
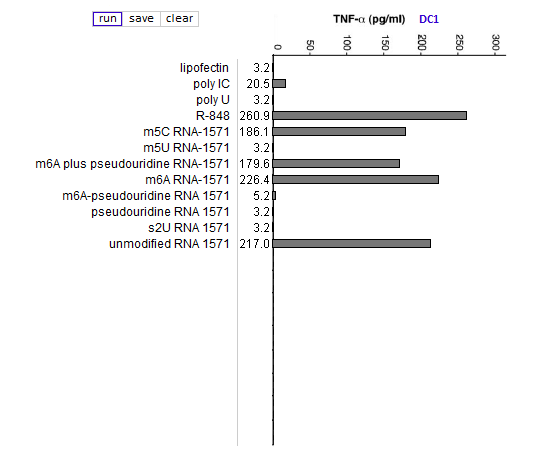
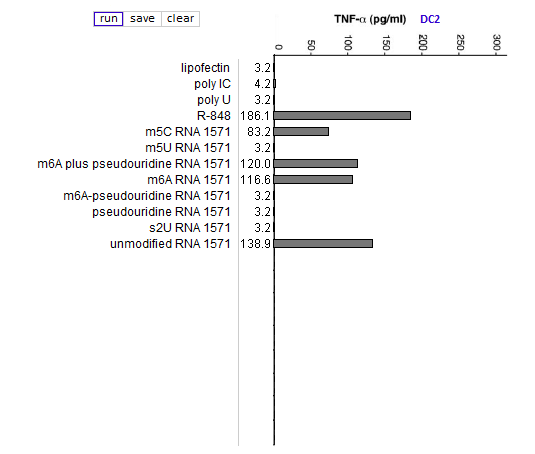
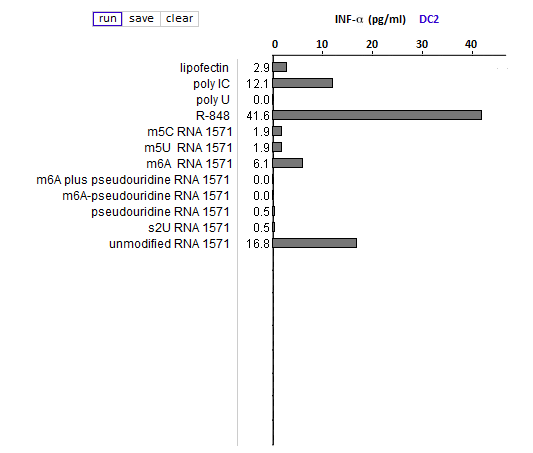
(1) Why were lipofection, poly IC and R-848 included in the cytokine ELISA runs?
As negative, positive, and positive controls, respectively.
(2) Is the relative effect of unmodified mRNA on cytokine production the same for the three cytokines (TNF-alpha, IL-12, and IFN-alpha)? What might account for any differences that you observed?
The relative effect of unmodified RNA was less for IFN-alpha, compared to the control (R-848), but unmodified RNA still had a greater effect on IFN-alpha production than RNA with modified nucleosides.
(3) What are the relative effects of the various nucleoside modifications for the three cytokines, comparing cytokine-generated DCs (MDDCs and IFN-alpha MDDCs) to primary blood DCs (DC1 and DC2)?
There was some variability for the cytokine-generated DCs, although the overall effect was suppression of the immune response. For the primary blood DCs, the three modifications that involved uracil (pseudouridine, m5U, and s2U) completely suppressed cytokine production in dendritic cells, but the modifications involving cytosine and adenine (m5C and m6A, respectively) did not suppress cytokine production.
(4) For DC1 and DC2, compare the production of cytokines when exposed to RNA modified with:
—pseudouridine alone
—m6A alone
—a mixture of pseudouridine-modified RNA and m6A-modified RNA, in separate molecules (“m6A plus pseudouridine”)
—RNA with both modifications on the same molecule (“m6A-pseudouiridine”)
What conclusion can be reached from this comparison, and why is this conclusion so significant?
Pseudouridine-modified RNA did not induce a cytokine response whereas m6A-modified RNA induced a strong response. When modifications were in separate molecules, a mixture of pseudouridine and m6A-modified RNA induced a strong immune response, but not when the modifications were on the same molecule.
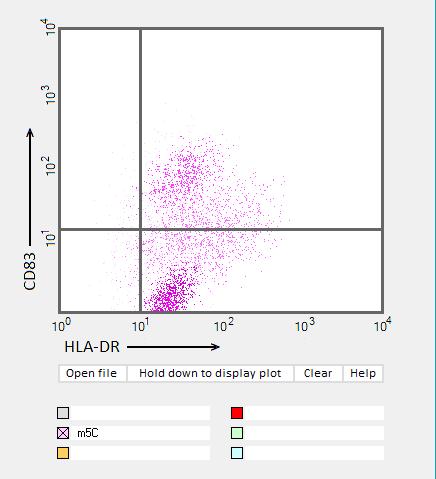
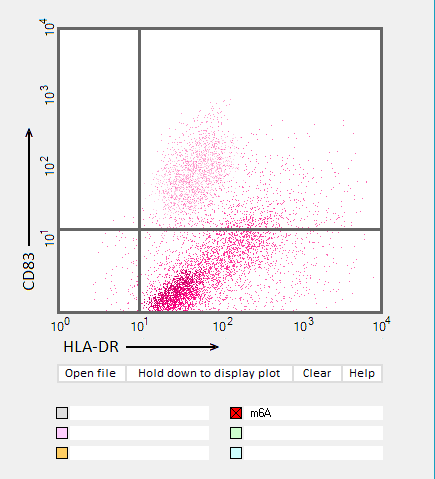
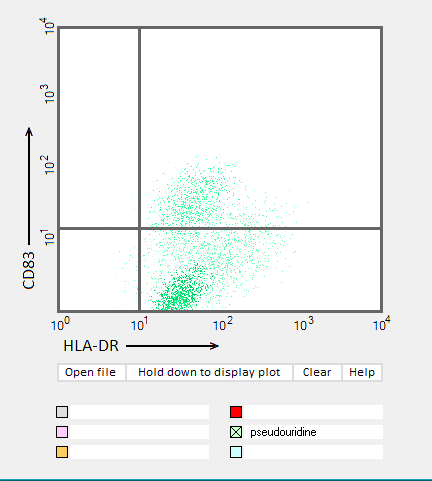
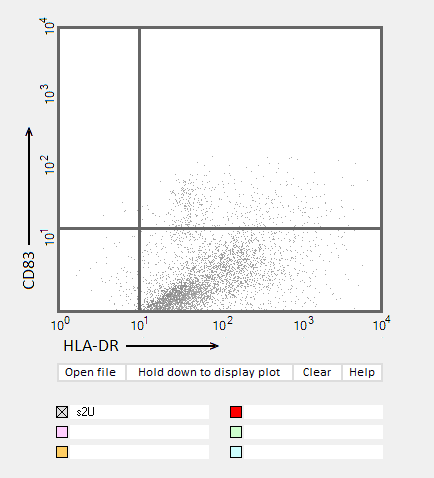
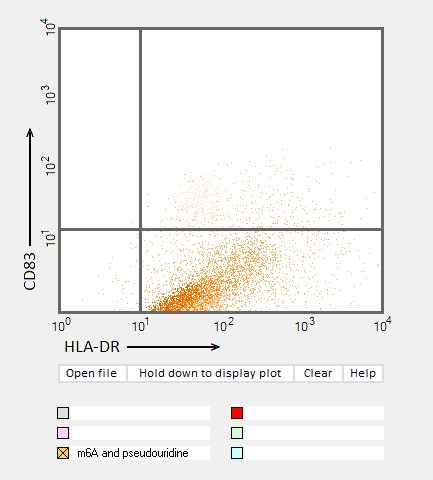
Answers to Question 22 of Part 3 – click to enlarge images.
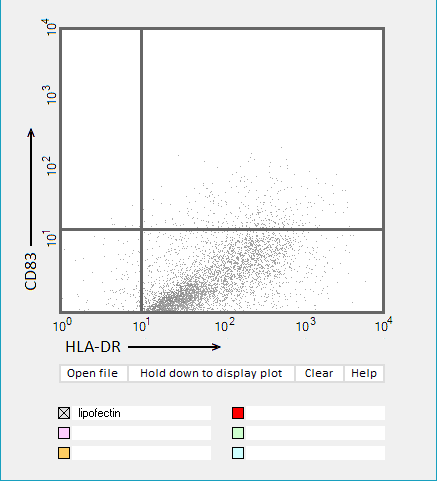
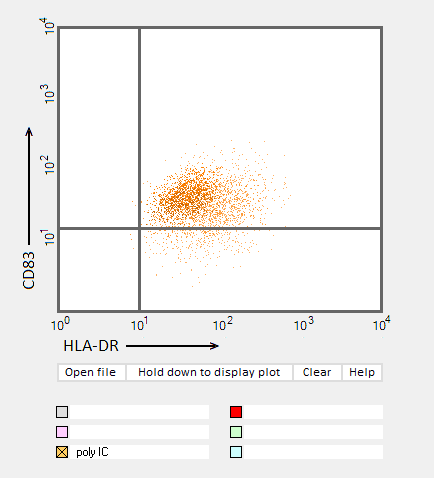
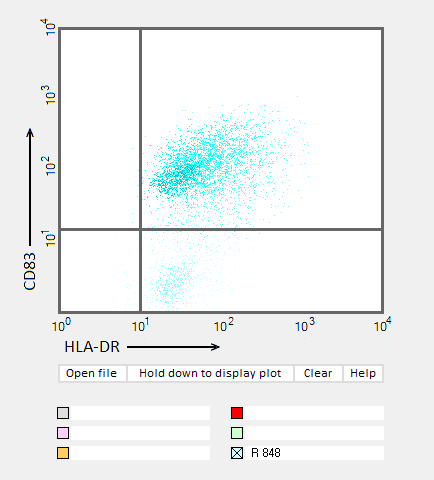
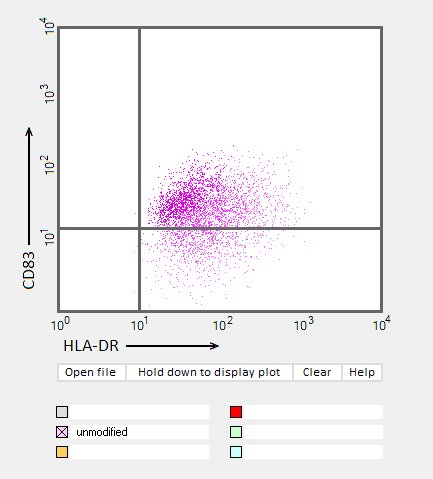
Note: Up to six colors can be plotted on one chart, but only one color is shown per plot for clarity.
(1) Why were CD83 and HLA-DR used for the flow cytometry analysis?
They are markers for mature dendritic cells associated with the immune response
(2) Do results from the flow cytometry analysis agree with results from the cytokine ELISA analyses in Parts 2 and 3?
Flow cytometry results show the general trend of nucleoside modifications suppressing the immune response but differ somewhat from experiments showing the cytokine response by DC1 and DC2 cells. The greatest reduction in the flow cytometry experiments was for RNA modified with s2U and m6A/pseudouridine.
(3) What general conclusions can you make based on the results of all of these analyses? Which of the mRNA modifications appear most effective at reducing the immune response?
Modifications of RNA nucleosides reduce the immune response, particularly for those nucleosides based on a modification of uracil.
(4) Consider this relatively recent publication on mRNA vaccines. How did Kariko et al. 2005 set the stage for the development of the COVID vaccines?
Kariko and her colleagues were the first to conclusively show that pseudouridine and other nucleoside modifications can suppress the ability of mRNA to induce an immune response. Pseudouridine is a component of both the Moderna and Pfizer COVID vaccines, so this critical finding has literally saved millions of lives.
